IPMI
The intelligent platform monitoring interface (IPMI) is a hardware-level specification for monitoring the operation of a computer system. In the case of the Luna Network HSM 7 appliance, IPMI monitors sensors within the appliance. Broad categories of these sensors are fans, power supplies and the system motherboard. Luna Network HSM 7 Appliance Sensors identifies:
>the specific sensors;
>their locations;
>the specific text string that represents each sensor;
>the thresholds for a sensor;
>threshold values;
>the unit of measure for each threshold.
Subsequent subsections of this document delve into each of the columns of the table, and the types of messages received:
Threshold Events
Here is an example sensor log.
2012 Feb 29 12:05:01 myLuna local4 notice ipmievd: Fan sensor Fan3B . Lower Critical going low (Reading 0 < Threshold 2000 RPM)
Most of the sensors monitored by IPMI on the Luna Network HSM 7 appliance generate threshold-based events. Threshold events occur when a sensor reading changes by an amount that crosses a configured boundary defined in the sensor data repository. THE IPMI specification defines six thresholds; the Luna Network HSM 7 appliance generates log messages on four of them. The four thresholds are:
1.Upper Non-Recoverable (UNR)
2.Upper Critical (UC)
3.Lower Non-Recoverable (LNC)
4.Lower Critical (LC)
Upper and lower critical thresholds are ‘fatal’ and mean that the hardware is exceeding above or below a specified rating respectively. Upper and lower non-recoverable thresholds are ‘potential damage’ and mean that the hardware is in jeopardy or damaged.
A sensor value can change in one of two ways. It can go to an active state which IPMI calls asserted. The second state is inactive or de-asserted.
IPMI also allows for a sensor to have a hysteresis. The importance of having a hysteresis is to reduce the chance of a “flood” of events as the sensor hovers around a threshold. For example, if a fan sensor has a going-low threshold of 1000 RPM and the reading goes slightly above and below this value repeated, IPMI will generate an event for every assertion and de-assertion as the reading crosses the 1000 RPM threshold. With a hysteresis of 100, for example, the event would assert at 1000 RPM but not de-assert until the reading was 1100 RPM or greater.
Combining the thresholds, hysteresis and state changes, IPMI has a means to create an event to describe what a sensor is doing. Event Assertion/Desertion Thresholds from the IPMI specification illustrates event assertion and desertion at different thresholds.
Figure 2: Event Assertion/Desertion Thresholds
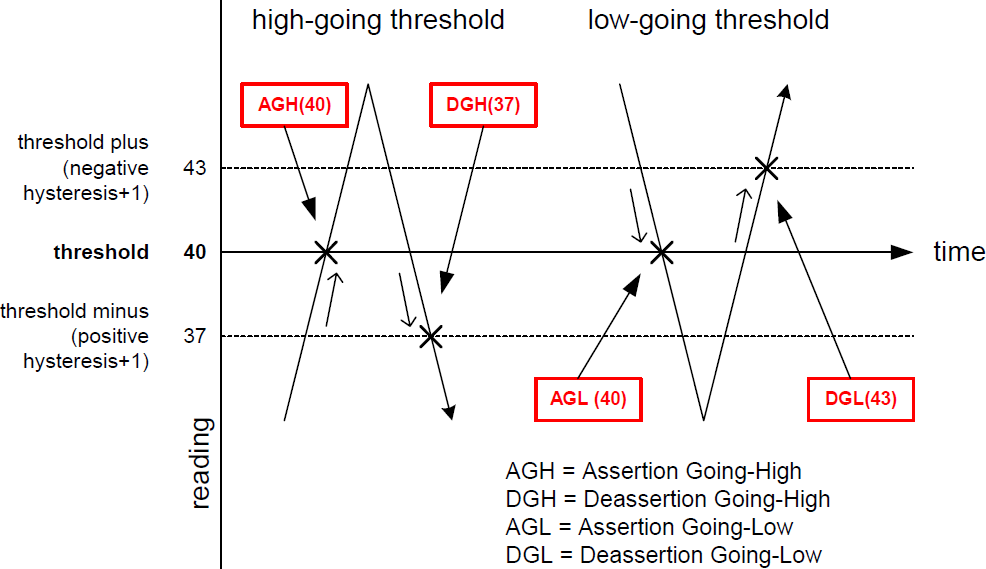
To apply the meaning of thresholds, hysteresis and states, consider a real sensor on the Luna appliance: a cooling fan. A normal fan speed varies but generally ranges between 4000 RPM and 6000 RPM. The fan speed can fall below a threshold (e.g., when it fails) or rise above a threshold (e.g., when the ambient air temperature rises and more cooling is necessary). By way of an example, assume that someone impedes the propeller of a fan blade to slow it down but not stop it entirely. After ten seconds, our antagonist impedes the fan blade so that it is barely turning. This sequence of events results in two log messages. The first represents a lower critical assertion going low; the second, a lower non-recoverable assertion going low.
2012 Feb 29 12:05:01 myLuna  local4 notice  ipmievd: Fan sensor Fan3B          . Lower Critical going low  (Reading 1600 < Threshold 2000 RPM)
2012 Feb 29 12:05:11 myLuna  local4 notice  ipmievd: Fan sensor Fan3B          . Lower Non-recoverable going low  (Reading 500 < Threshold 1000 RPM)
Correlating the information in these two log messages with the data in third, fourth and fifth columns of Luna Network HSM 7 Appliance Sensors, note that the first log message results because the fan speed has dropped below 2000 RPM to a reading of 1600 RPM (LC assert: 2000). The second message results because the fan speed has now crossed the non-recoverable threshold of 1000 RPM (LNR assert: 1000).
After some period, with one less fan to cool the appliance, it begins to heat up, leading to the baseboard management controller to command the remaining fans to speed up. At this time, our antagonist discontinues impeding the fan blade. It immediately begins to spin and joins the other five at a higher-than-normal RPM. When the BMC detects the temperature back at a normal value, the BMC commands the fans to return to their normal speeds. The following log message records this event, the sensor de-asserting the last threshold change. Note that several seconds have elapsed after the fan threshold deserted the LNR event and IPMI detected the change and read the sensor. Hence, the reading of 15900 represents a sensor value when the fans are at maximum revolutions.
2012 Feb 29 12:05:21 myLuna local4 notice ipmievd: Fan sensor Fan3B . Lower Non-recoverable going low (Reading 15900 < Threshold 1000 RPM)
Upon examining log messages, you might also observe instances where two messages similar to the following examples occur in close proximity:
2012 Feb 29 12:05:01 myLuna  local4 notice  ipmievd: Fan sensor Fan3B          . Lower Critical going low  (Reading 0 < Threshold 2000 RPM)
2012 Feb 29 12:05:51 myLuna  local4 notice  ipmievd: Fan sensor Fan3B          . Lower Non-recoverable going low  (Reading 15900 < Threshold 1000 RPM)
The first message is the event of the fan stopping. The second message is the fan speed going from very fast back to a normal range after it has become freed to spin again and join the other five fans to cool the overheating appliance. This second log message represents the de-assert LNR event: by the time IPMI has scanned and read the sensors, the fan has asserted the LNR event and subsequently de-asserted it. IPMI only generates the log message for the more recent of the two events.
Discrete Events
The Luna appliance reports three discrete events:
1.OEM #0xa1. Because the IPMI specification does not define a power reset function, an OEM sensor serves this purpose. This OEM sensor links to a system reset function. The BMC records an event in the event log for a system reset: by pushing the power button; through a BMC reset; or via an operating system reset.
2.Power Supply PSU1_Status. This event reports the presence (asserted) or absence (de-asserted) of the right power supply.
3.Power Supply PSU2_Status. This event reports the presence (asserted) or absence (de-asserted) of the left power supply.
CPU Sensor
The CPU temperature reflects the use of the platform environment control interface (PECI) specification used for thermal management in the Intel Core 2 Duo microprocessor. PECI reports a negative value that expresses the difference between the current temperature and the thermal throttle point at which the CPU takes action to reduce speed or shut down to prevent damage. In other words, the PECI value is a relative and not an absolute temperature. The value reported by IPMI is calculated as the measured PECI value + an offset + a margin. As an example, if the PECI value is -89, the offset is 92 and the margin is 0, the IPMI reported temperature is 11 degrees C. This value is representative of a Luna appliance operating in a climate controlled data center. The important point is to monitor the CPU value in relation to the upper critical threshold of 72 degrees C and not as an absolute measure of the temperature of this sensor.
VRD, PCH, and Inlet Sensors
The VRD, PCK and Inlet sensor values reported by IPMI reflect real-time temperature values. They differ in readings because of the heat generated at the different locations within the chassis (e.g., inlet near fans, PCH consumes considerable power).
IPMI Implementation
The principal entity responsible for reporting IPMI events within the Luna appliance is a daemon called ipmievd. This daemon listens for events from the baseboard management controller (BMC) sent to the system event log (SEL). ipmievd polls the contents of the SEL for new events. When it receives a new event, the daemon logs it to syslog. ipmievd is a standard Linux component, used unchanged by Thales. The daemon is based on the ipmitool utility and it shares the same IPMI support and session setup options: some of the potential log messages from ipmievd originate from the ipmitool utility.
ipmievd can potentially generate hundreds of different log messages. Of these potential messages, some are sensor-specific. Other messages are unlikely but, because Thales uses the Linux component unchanged, are possible. The first subsection that follows describes the sensor events of most interest. The succeeding three subsections show insignificant messages, followed by the unlikely ones and debug messages.
Significant Log Messages
The log messages described in this subsection are the ones that report pertinent sensor events. The IPMI daemon reports on the sensor types shown in Luna Network HSM 7 Appliance Sensor Types.
| Sensor Type |
|---|
| Fan |
| Temperature |
| Voltage |
| Power Supply |
| OEM |
Full Sensor Record Threshold Reading

A full sensor record threshold reading message consists of the fields shown in the example above.
1.This field is the sensor type, one of values from Luna Network HSM 7 Appliance Sensor Types.
2.This field is the specific sensor from column 2 of Luna Network HSM 7 Appliance Sensors.
3.This field is the description, formed from the threshold of column 3 of Luna Network HSM 7 Appliance Sensors combined with the direction of the threshold.
4.This field is the trigger reading as reported by the BMC for the sensor.
5.This field is the comparison that resulted in the event.
6.This field is the threshold value of column 4 of Luna Network HSM 7 Appliance Sensors for the applicable threshold.
7.This field is the unit of measure from column 5 of Luna Network HSM 7 Appliance Sensors.
Reproducing all possible threshold messages within this document is impractical. Rather, a more reasonable solution is to provide guidance for how to parse threshold messages.
1.Parse for ipmievd and Threshold in the log message.
2.Determine whether the event is an assertion or de-assertion. Use fields 4, 5 and 6 for this step. The event is an assertion if the logical evaluation of the statement formed from these three fields is true (e.g., Reading 1600 < Threshold 2000 RPM). Otherwise, the event is a de-assertion (e.g., Reading 15900 < Threshold 1000 RPM).
3.Parse the remaining fields to obtain the sensor type, specific sensor affected, the trigger reading, the threshold, the threshold value and the unit of measure.
With the information of the above list, you have the information available to create custom messages and/or take specific actions for threshold events.
Compact Sensor Record Asserted/Deasserted
2012 Feb 29 12:05:01 myLuna  local4 notice  ipmievd: Power Supply sensor PSU2_Status    . - Failure detected Asserted
2012 Feb 29 12:05:01 myLuna  local4 notice  ipmievd: Power Supply sensor PSU2_Status    . - Failure detected Deasserted
The first field after ipmievd: is the sensor type: see Luna Network HSM 7 Appliance Sensor Types. The text after sensor is the specific sensor from column 2 of Luna Network HSM 7 Appliance Sensors. The text after the dash is the description of the event with a specific indication of either Asserted or De-asserted at the end of the message.
You should review these messages within the context of any administrative or maintenance activities carried out on the Luna appliance. The severity and action depends upon what is reported. In the two examples above, the first log message indicates that PSU2 failed (e.g., A/C lost) while the second message indicates that PSU2 once again became operational.
Non-Specific Sensor Record with Description
2012 Feb 29 12:05:01 myLuna  local4 notice  ipmievd: Power Supply sensor - Transition to Power Off
2012 Feb 29 12:05:01 myLuna  local4 notice  ipmievd: OEM sensor - OEM Specific
2012 Feb 29 12:05:01 myLuna  local4 notice  ipmievd: Power Unit sensor - Failure detected*
* Reported by BMC firmware on older Luna appliances.
These messages represent log entries for non-specific sensor records as per the IPMI specification. The first field after ipmievd: is the sensor type: see Luna Network HSM 7 Appliance Sensor Types. The text after the dash is the description of the event.
Like the compact sensor records, the context of any administrative or maintenance activities carried out on the Luna Network HSM 7 appliance as well as the description affects the action appropriate for the log message.
Insignificant Log Messages
The following log messages represent start up notices for ipmievd.
Reading Sensors
2012 Feb 29 12:05:01 myLuna local4 notice ipmievd: Reading sensors...
This message indicates that the IPMI monitoring daemon successfully started just prior to setting up the event handler.
Waiting For Events
2012 Feb 29 12:05:01 myLuna local4 notice ipmievd: Waiting for events...
This message indicates that the IPMI monitoring daemon successfully established communication with the IPMI device driver to relay events.
Unlikely Log Messages
Under normal circumstances, you should not see any of these log messages. If you do, please contact Thales Technical Support to report the message and seek guidance on what to do next.
No ipmievd Messages in Log File
If you do not see any ipmievd messages in the messages log file, check to see if rsyslogd is running.
Kernel Panic
2012 Feb 29 12:05:01 myLuna local4 alert ipmievd: Linux kernel panic: mod xyz fai
A “panic” is an unrecoverable system error detected by the Linux kernel. A panic can result from unhandled processor exceptions such as references to invalid memory addresses. In the case of an IPMI-reported panic, the likely cause is a hardware failure such as a failed RAM cell, errors in the arithmetic functions of the processor or an overheating/damaged processor. If you find this message in the log files, review other messages around it for an indication of what might have failed. Power up the appliance again and monitor for similar events.
OEM Record
2012 Feb 29 12:05:01 myLuna local4 notice ipmievd: IPMI Event OEM Record 0xa1
Thales knows of no OEM records for the Luna appliance.
Sensor Record without Description
2012 Feb 29 12:05:01 myLuna local4 notice ipmievd: Power Supply sensor 0xa2
Sensor records with description should be all that the daemon reports. Note that the difference between a sensor record with a description versus one without is the dash after the word sensor in the message. See the subsection Full Sensor Record Threshold Reading for a discussion of the records you should be most interested in.
Full Sensor Record for Discrete and OEM Events
2012 Feb 29 12:05:01 myLuna  local4 notice  ipmievd: Power Supply sensor PSU1_Status    .
2012 Feb 29 12:05:01 myLuna  local4 notice  ipmievd: Power Supply sensor PSU1_Status    . some status message
A “full sensor record” is one formatted as <sensor name> sensor <full sensor name> <description>. This formatting is for discrete and OEM sensor events for which the Luna Network HSM 7 appliance reports none of these types.
Compact Sensor Record With No Event Direction
2012 Feb 29 12:05:01 myLuna local4 notice ipmievd: Power Supply sensor PSU2_Status . - Failure detected
This formatting is for compact sensor records with no direction reported for the threshold change. Thales is not aware of any events that report a message according to this format.
Sensor Record With Only Sensor Number
2012 Feb 29 12:05:01 myLuna local4 notice ipmievd: Fan sensor 16
Thales is not aware of any events that report a message according to this format.
BMC Event Message Buffer Failure
2012 Feb 29 12:05:01 myLuna  local4 err  ipmievd: Get BMC Global Enables command failed
2012 Feb 29 12:05:01 myLuna  local4 err  ipmievd: Get BMC Global Enables command failed: 71
2012 Feb 29 12:05:01 myLuna  local4 err  ipmievd: Set BMC Global Enables command failed
2012 Feb 29 12:05:01 myLuna  local4 err  ipmievd: Set BMC Global Enables command failed: 23
Before the IPMI daemon can log messages, it must first open the BMC event message buffer. Under normal circumstances, this operation succeeds.
Unable to Receive IPMI Message
2012 Feb 29 12:05:01 myLuna local4 err ipmievd: Unable to receive IPMI message
The Luna Network HSM 7 appliance loads the IPMI device drivers before starting the IPMI daemon. This message means that the request to the device driver for an IPMI event message failed.
No Event Data
2012 Feb 29 12:05:01 myLuna local4 err ipmievd: No data in event
All IPMI messages for the Luna Network HSM 7 appliance have well-formed event data. This message means that the IPMI daemon read an event from the IPMI message buffer but the event had no data associated with it.
Not An Event
2012 Feb 29 12:05:01 myLuna local4 err ipmievd: Type 9 is not an event
Only the asynchronous event receive type should be available in the BMC event message buffer. This message means that the IPMI daemon read an event from the IPMI message buffer that was not the expected asynchronous receive type.
Unable to Read from IPMI Device
2012 Feb 29 12:05:01 myLuna local4 critical ipmievd: Unable to read from IPMI device
This message means that the IPMI daemon failed to read from the event message buffer while polling for events.
Get SEL Info Command Failed
2012 Feb 29 12:05:01 myLuna  local4 err  ipmievd: Get SEL Info command failed
2012 Feb 29 12:05:01 myLuna  local4 err  ipmievd: Get SEL Info command failed: 80
These messages indicate that the IPMI daemon was unable to get the system event log information for the storage network function.
SEL Buffer Use
2012 Feb 29 12:05:01 myLuna local4 warning ipmievd: SEL buffer used at 85%, please consider clearing the SEL buffer
This message means that the sensor event log buffer is filling faster than events can be processed by the IPMI daemon.
SEL Buffer Overflow
2012 Feb 29 12:05:01 myLuna local4 alert ipmievd: SEL buffer overflow, no SEL message can be logged until the SEL buffer is cleared
This message means that the sensor event log buffer is full and no new messages can be queued.
Unable to Retrieve SEL Data
2012 Feb 29 12:05:01 myLuna local4 err ipmievd: Unable to retrieve SEL data
This message means that the IPMI daemon was unable to receive sensor event log data when it should have.
SEL Overflow on Check for Waiting Events
2012 Feb 29 12:05:01 myLuna  local4 notice  ipmievd: SEL overflow is cleared
2012 Feb 29 12:05:01 myLuna  local4 alert  ipmievd: SEL buffer overflow, no new SEL message will be logged until the SEL buffer is cleared
2012 Feb 29 12:05:01 myLuna  local4 warning  ipmievd: SEL buffer is 85% full, please consider clearing the SEL buffer
The IPMI daemon should process sensor event log messages in a timely fashion. These messages mean that the daemon is falling behind in doing so.
PID File Already Exists
2012 Feb 29 12:05:01 myLuna  local4 err  ipmievd: PID file '/var/run/ipmievd.pid0' already exists.
2012 Feb 29 12:05:01 myLuna  local4 err  ipmievd: Perhaps another instance is already running.
These messages suggest: a failure of the operating system or file structure within the appliance; or a configuration error within a Thales-provided component.
Failed to Open PID File
2012 Feb 29 12:05:01 myLuna local4 err ipmievd: Failed to open PID file '/var/run/ipmievd.pid0' for writing. Check file permission.
This message suggests a failure of the operating system or file structure within the appliance.
Unable to Open SDR File
2012 Feb 29 12:05:01 myLuna local4 err ipmievd: Unable to open SDR for reading
This message suggests a failure in the IPMI subsystem.
Malloc Failure
2012 Feb 29 12:05:01 myLuna local4 err ipmievd: ipmitool: malloc failure
This message indicates that the system is low on virtual memory while attempting to create a cache for the sensor data repository.
IPMI Event Setup Failed
2012 Feb 29 12:05:01 myLuna  local4 err  ipmievd: Could not enable event message buffer
2012 Feb 29 12:05:01 myLuna  local4 err  ipmievd: Could not enable event receiver
2012 Feb 29 12:05:01 myLuna  local4 err  ipmievd: Error setting up Event Interface open
These messages indicate a failure of the ipmievd daemon to establish the interface via the IPMI device driver to relay events.
Error Waiting For Events
2012 Feb 29 12:05:01 myLuna local4 err ipmievd: Error waiting for events!
This message indicates a failure by the daemon to wait for events relayed via the IPMI device driver.
Unable to Load Event Interface
2012 Feb 29 12:05:01 myLuna local4 err ipmievd: Unable to load event interface
This message indicates a failure by the daemon to establish the IPMI event interface.
Invalid Interface
2012 Feb 29 12:05:01 myLuna local4 err ipmievd: Invalid Interface for OpenIPMI Event Handler: <xxxxx>
This message suggests a corrupted disk system or a configuration error: the only potential value for <xxxxx> is “open.”
Debug Messages
Thales does not enable logging of debug messages from the IPMI daemon. If in future Thales does enable this level of log messages, this subsection describes the possible messages you might find in the log files.
BMC Event Message Buffer Opened
2012 Feb 29 12:05:01 myLuna local4 debug ipmievd: BMC Event Message Buffer enabled
This message indicates that the IPMI daemon successfully opened the BMC event message buffer.
BMC Event Message Debug
2012 Feb 29 12:05:01 myLuna local4 debug ipmievd: netfn:6 cmd:5 ccode:80
This message shows the network function code, command and completion code of the raw IPMI message.
SEL Watch Debug
2012 Feb 29 12:05:01 myLuna  local4 debug  ipmievd: SEL count is 3
2012 Feb 29 12:05:01 myLuna  local4 debug  ipmievd: SEL freespace is 1502
2012 Feb 29 12:05:01 myLuna  local4 debug  ipmievd: SEL Percent Used: 80%
2012 Feb 29 12:05:01 myLuna  local4 debug  ipmievd: SEL Overflow: false
2012 Feb 29 12:05:01 myLuna  local4 debug  ipmievd: SEL Next ID: 00da
2012 Feb 29 12:05:01 myLuna  local4 debug  ipmievd: SEL lastid is 00d9
2012 Feb 29 12:05:01 myLuna  local4 debug  ipmievd: Current SEL count is 4
2012 Feb 29 12:05:01 myLuna  local4 debug  ipmievd: Current SEL lastid is 00ac
2012 Feb 29 12:05:01 myLuna  local4 debug  ipmievd: SEL count is 0 (old=3), resetting lastid to 0
2012 Feb 29 12:05:01 myLuna  local4 debug  ipmievd: SEL count lowered, new SEL lastid is 0112
2012 Feb 29 12:05:01 myLuna  local4 debug  ipmievd: SEL Read ID: 023f
2012 Feb 29 12:05:01 myLuna  local4 debug  ipmievd: New Events
These messages show details of the sensor event log at various processing points within the daemon.
Sensors Cached
2012 Feb 29 12:05:01 myLuna  ipmievd: Getting 8 bytes from SDR at offset 64
2012 Feb 29 12:05:01 myLuna  ipmievd: SDR reservation cancelled. Sleeping a bit and retrying...
2012 Feb 29 12:05:01 myLuna  ipmievd: Sensors cached
These messages indicate that the IPMI daemon successfully generated a fast lookup cache for the sensor data repository.
IPMI Event Setup
2012 Feb 29 12:05:01 myLuna  ipmievd: Enabling event message buffer
2012 Feb 29 12:05:01 myLuna  ipmievd: Enabling event receiver
2012 Feb 29 12:05:01 myLuna  ipmievd: Getting 8 bytes from SDR at offset 64
These messages log the process to set up the IPMI event interface.